Samlex America EVO-30AB Manuel utilisateur
- Taper
- Manuel utilisateur

30 Amp
Solar Charge
Controller
EVO-30AB
Read this manual
before operating
your charge
controller.
Owner's
Manual

2 | SAMLEX AMERICA INC.
OWNER'S MANUAL | Index
Table of Contents
SECTION 1
1. Safety Instructions ......................................................................................... 5
1.1 Installation and Wiring Compliance .....................................................5
1.2 Preventing Electrical Shock .................................................................... 5
1.3 Installation Environment ........................................................................5
1.4 Preventing Fire and Explosion Hazards ..................................................5
SECTION 2
2. Solar Panel Power Theory ..............................................................................6
2.1 Solar Panel Ratings and Power Curves....................................................6
2.2 Maximum Power Point ..........................................................................6
2.3 Standard Test Conditions (STC) for Specifying Solar Panels ................... 7
2.4 Factors Affecting Output of Solar Cell ...................................................7
SECTION 3
3. Battery Theory ...............................................................................................8
3.1 Battery Capacity in Ah and RC .............................................................8
3.1.1 Sizing the Battery Bank ............................................................. 8
3.2 Series and Parallel Connection of Batteries ......................................... 10
3.2.1 Series Connection ................................................................... 10
3.2.2 Parallel Connection ................................................................. 10
3.2.3 Series - Parallel Connection .....................................................11
3.3 Lead Acid Batteries .............................................................................12
3.3.1 Battery Types ...........................................................................12
3.3.2 Typical Battery Sizes ................................................................13
3.3.3 Reduced Capacity at Higher Discharge ...................................13
3.3.4 Battery Efciency ....................................................................14
3.3.5 Impact of Depth of Discharge on Battery Life .........................14
3.3.6 Effect of Temperature on Lead Acid Batteries .........................14
3.4 Lithium Batteries ................................................................................. 15
3.4.1 Effects of Temperature on Lithium Batteries ...........................16
3.4.2 Lithium Batteries in Series and Parallel ....................................16
SECTION 4
4. Features and Operation ..............................................................................16
4.1 Features ..............................................................................................16
4.1.1 Standalone Charge Controller .................................................17
4.1.2 Expanded Use with Other EVOTM Products ..............................17
4.2 EVO-30AB Charging Operation ..........................................................18
4.2.1 Pulse Width Modulation ..........................................................18
4.2.2 Standard Charging Cycle .........................................................19
4.2.3 Lead Acid Charging .................................................................20
4.2.4 Equalization Charging Cycle ....................................................21
4.2.5 Temperature Compensation ....................................................24
4.3 Lithium Battery Charging ....................................................................24

2 | SAMLEX AMERICA INC. SAMLEX AMERICA INC. | 3
SECTION 5
5. Construction, Layout & Controls ................................................................. 25
5.1 General ............................................................................................... 25
5.2 Controls & Indications ........................................................................26
5.3 EVO-RC-PLUS Remote Display Operation ...........................................27
5.3.1 Navigating the Remote............................................................27
5.3.2 EVO-RC-PLUS Display Screens .................................................28
SECTION 6
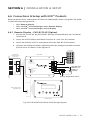
6. Installation & Setup .....................................................................................32
6.1 Wire Sizing .......................................................................................... 32
6.2 Selecting a Location and Mounting ....................................................33
6.3 Connections and Setup .......................................................................34
6.3.1 DIP Switch Settings ...................................................................35
6.4 Equalization Operation ........................................................................36
6.4.1 Manual Equalization .................................................................37
6.4.2 Automatic Equalization .............................................................37
6.5 Temperature Compensation Operation ............................................... 37
6.6 Expanded Use: Connections & Setup .................................................. 39
6.6.1 Remote Display - EVO-RC-PLUS (Option)..................................39
6.6.2 EVO-30AB with EVOTM Inverter/Charger
and EVO-RC-PLUS ....................................................................40
6.6.3 EVO-30AB with EVOTM Inverter/Charger
(No EVO-RC-PLUS) ...................................................................41
SECTION 7
7. Troubleshooting ..........................................................................................42
7.1 Fault Indicators .................................................................................... 42
7.2 Symptom 1. Battery is not Charging ...................................................43
7.3 Symptom 2. Battery Voltage is too High .............................................43
SECTION 8
8. Specications ..............................................................................................44
SECTION 9
9. Warranty ...................................................................................................45
OWNER'S MANUAL | Index

4 | SAMLEX AMERICA INC.
OWNER'S MANUAL | Index
List of Tables
Table 3.1 Battery Sizing Formulas ......................................................................9
Table 3.2 Popular Battery Sizes ........................................................................13
Table 3.3 Battery Capacity versus Rate of Discharge .......................................13
Table 3.4 Typical Cycle Life Chart ....................................................................14
Table 3.5 Absorption Voltage vs Temperature (example)...................................14
Table 4.1 Lithium Battery Prole Settings ........................................................24
Table 5.1 LED Display for Charging Stages & Faults ........................................26
Table 5.2 Push Button and Switch Descriptions ...............................................26
Table 5.3 Operational Screens .........................................................................29
Table 5.4 LCD Display Parameters ...................................................................30
Table 6.1 Recommended Wire Size ................................................................. 32
Table 6.2 Dip Switching Settings .....................................................................35
Table 6.3 Standard Battery Charging Programs ............................................... 36
Table 6.4 Temperature Compensation of Voltage Settings .............................. 38
Table 7.1 Fault Indications & Remedies ...........................................................42
List of Figures
Fig 2.1 Current (I), Voltage (V) and Power (P) Curves ........................................6
Fig 2.2 I-V Curve and Ratings of a 12V PV / Solar Panel ......................................7
Fig 3.1 Series Connection ...............................................................................10
Fig 3.2 Parallel Connection .............................................................................10
Fig 3.3 Series-Parallel Connection ...................................................................11
Fig 3.4 Temperature vs State of Charge ..........................................................15
Fig 4.1 Series Type PWM Control – PWM Frequency = 300 Hz .......................18
Fig 4.2A Normal Charging Algorithm .............................................................19
Fig 4.2B Equalization Algorithm ...................................................................... 19
Fig 5.1 EVO-30AB Layout ................................................................................25
Fig 5.2 EVO-RC-PLUS Layout ...........................................................................27
Fig 5.3 Startup Screen .....................................................................................28
Fig 5.4 EVO-RC-PLUS and EVO-30AB Menu Map ...........................................31
Fig 6.1 EVO-30AB Dimensions ........................................................................ 33
Fig 6.2 EVO-30AB Wiring Diagram ................................................................. 34
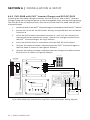
Fig 6.3 EVO-30AB with EVO-RC-PLUS Wiring Diagram ..................................39
Fig 6.4 EVO-30AB with EVO-RC-PLUS and
EVOTM Inverter/Charger Wiring Diagram .............................................40
Fig 6.5 EVO-30AB with EVOTM Inverter/Charger .............................................41
Disclaimer of Liability
UNLESS SPECIFICALLY AGREED TO IN WRITING, SAMLEX AMERICA INC.:
1. MAKES NO WARRANTY AS TO THE ACCURACY, SUFFICIENCY OR SUITABILITY OF ANY TECHNICAL OR OTHER INFORMATION
PROVIDED IN ITS MANUALS OR OTHER DOCUMENTATION.
2. ASSUMES NO RESPONSIBILITY OR LIABILITY FOR LOSSES, DAMAGES, COSTS OR EXPENSES, WHETHER SPECIAL, DIRECT,
INDIRECT, CONSEQUENTIAL OR INCIDENTAL, WHICH MIGHT ARISE OUT OF THE USE OF SUCH INFORMATION. THE USE OF
ANY SUCH INFORMATION WILL BE ENTIRELY AT THE USERS RISK.
Samlex America reserves the right to revise this document and to periodically make changes to the content
hereof without obligation or organization of such revisions or changes.
Copyright Notice/Notice of Copyright
Copyright © 2022 by Samlex America Inc. All rights reserved. Permission to copy, distribute and/or modify this
document is prohibited without express written permission by Samlex America Inc.

4 | SAMLEX AMERICA INC. SAMLEX AMERICA INC. | 5
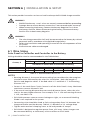
SECTION 1 | SAFETY INSTRUCTIONS
Read instructions before installing or operating the Charge Controller to prevent per-
sonal injury and avoid damage to the Charge Controller.
1.1 Installation and Wiring Compliance
• Installation and wiring must comply with the local and National Electrical
Codes and must be done by a certied electrician.
1.2 Preventing Electrical Shock
• The negative system conductor should be properly grounded. Grounding
should comply with local codes.
• Disassembly / repair should be carried out by qualied personnel only.
• Disconnect all input and output connections before working on any circuits
associated with the Charge Controller.
1.3 Installation Environment
• The Charge Controller should be installed in a well ventilated, cool, dry
environment.
• Do not expose to moisture, rain, snow or liquids of any type.
1.4 Preventing Fire and Explosion Hazards
• Working with the Charge Controller may produce arcs or sparks. Thus, the
Charge Controller should not be used in areas where there are ammable
materials or gases requiring ignition protected equipment. These areas may
include spaces containing gasoline powered machinery, fuel tanks, battery
compartments.

6 | SAMLEX AMERICA INC.
SECTION 2 | SOLAR PANEL POWER THEORY
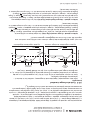
2.1 Solar Panel Ratings and Power Curves
Fig. 2.1. Current (I),Voltage (V) and Power (P) Curves
A Current (I) versus Voltage (V) Curve of a Solar Panel (“I-V” Curve) shows the possible
combinations of its current and Voltage outputs. A typical I-V curve for a 12V Panel is
shown in Fig. 2.1.
The power in a DC electrical circuit is the product of the Voltage and the current.
Mathematically,
• Power (P) in Watts (W) = The Current (I) in Amperes (A) X the Voltage (V) in
Volts (V) i.e. W = V x A
A Solar Panel produces its maximum current when there is a short circuit between its
Positive and Negative terminals. This maximum current is known as the Short Circuit Current
and is abbreviated as Isc. When the Panel is shorted, the Voltage in the circuit is zero.
Conversely, the maximum Voltage occurs when there is a break in the circuit. This is
called the Open Circuit Voltage (Voc). Typical value of the Open Circuit Voltage (Voc) of
panels with crystalline cells will be as follows:
- 12V panel: 36 cells x (0.5 to 0.6V per cell) = 18V to 21.6V
- 24V panel: 72 cells x (0.5 to 0.6V per cell) = 36V to 43.2V
The power available from a photovoltaic device at any point along the curve is just the
product of Current (I) in Amps (A) and voltages (V) at that point and is expressed in
Watts. At the short circuit current point, the power output is zero, since the voltage is
zero. At the open Circuit Voltage point, the power output is also zero, but this time it
is because the current is zero.
2.2 Maximum Power Point
There is a point on the knee of the I-V Curve where the maximum power output is
located and this point is called the Maximum Power Point (MPP). The voltage and
current at this Maximum Power Point are designated as Vmp and Imp.

6 | SAMLEX AMERICA INC. SAMLEX AMERICA INC. | 7
SECTION 2 | SOLAR PANEL POWER THEORY
The rated power of the Solar Panel in Watts (Pmax) is derived from voltage at Vmp
multiplied by current at Imp to get the Maximum Power Point (MPP):
• Rated power in Watts, Pmax = Vmp X Imp
= 2.5A
= 17A
=
=
= 2.7A
= 21V
Fig. 2.2. I-V Curve and Ratings of a 12V PV / Solar Panel
I-V Curve for a typical 12V Solar Panel is shown in Fig. 2.2. The Open Circuit Voltage Voc
is 21V and the Short Circuit Current Isc = 2.7V.
Maximum Power Point in the example curve given above is where Vmp is 17V, and the
current Imp is 2.5A. Therefore, the rated or the maximum power Pmax in watts is 17V
times 2.5A, or 42.5 Watts.
2.3 Standard Test Conditions (STC) for Specifying Solar Panels
The industry uses three standard conditions to generate the I-V curve and other
specications for the solar panel. These STC are made up from three conditions:
• Temperature – the temperature of the cell and not the surrounding air or metal
of the panel. STC=25C.
• Solar-Irradiance – The amount of light energy falling on the panel. STC=1000W/m
• Mass of air – The number is related to the angle of light and amount of
atmosphere STC=1.5.
When the panels are rated based on these industry standards, designers are able to
compare products.
2.4 Factors Affecting Output of Solar Cells
The amount of electric current generated by photon excitation in a Solar Cell at a
given temperature is affected by light in two ways:
• By the intensity of the incident light.
• By the wavelength of the incident rays.

8 | SAMLEX AMERICA INC.
The output current of the Solar Panel can increase due to what is known as the “Edge
of the Cloud Effect”. As the sun moves into a hole between the clouds, your solar
panels will see full direct sunlight combined with reected light from the clouds! They
will absorb more energy than they could on a cloudless day! Thus, a factor of 1.25
times the Short Circuit Current Isc is recommended when sizing the current capacity
of the Charge Controller.
The output current of the Solar Cell has a Positive Temperature Coefcient – the
output current increases with the rise of temperature. However, it is negligible – less
than 0.1 % / °C of the Short Circuit Current Isc.
The output Voltage of the Solar Cell has a Negative Temperature Coefcient – The
output Voltage increases with decrease in temperature. For example, a Silicon Cell
has a Temperature Coefcient of – 2.3 mV / °C / Cell. Hence, during cold winter days,
the voltage will rise. As a Rule of Thumb, the voltage rating of the Charge Controller
should be sized as 1.25 times the Open Circuit Voltage rating (Voc) of the Solar
Panel to ensure that the Charge Controller is not damaged due to over voltage.
SECTION 3 | BATTERY THEORY
3.1 Battery Capacity in Ah and RC
Battery capacity is the measure of electrical energy the battery can store and deliver to
a load. It is determined by the amount of current any given battery can deliver over a
stipulated period of time. The energy rating is often expressed in Ampere Hours (Ah)
or in Reserve Capacity (RC).
Ampere Hours is the rating of a battery calculated by the Amps x Hours.
Amps is the current being drawn from the battery and hours is the time to discharge
the battery. This information is found in the tables on the battery manufacturer sheet.
It is specied on spec sheets as 100Ah: @20hr rate to 1.75 VPC.
In this case the 100Ah capacity is rated at 20 Hour discharge rate until the voltage
drops to 175V per cell (or 10.5V on a 12V battery).
Battery capacity is also expressed as Reserve Capacity (RC) in minutes on some lead
acid batteries. Reserve Capacity is the time in minutes for which the battery can deliver
25 Amperes at 80ºF (26.7ºC).
3.1.1 Sizing The Battery Bank
The necessary capacity of the battery bank in Ampere Hours (Ah) is determined based
on the amps required to be provided for operating the desired DC and AC loads for a
desired period of time in hours.
SECTION 2 | SOLAR PANEL POWER THEORY

8 | SAMLEX AMERICA INC. SAMLEX AMERICA INC. | 9
For example, backup energy may be required at 10 amps (from the battery at the
battery voltage) for 4 hours. This would be 40 AH required from the battery.
Determining the size of the battery starts with calculating your requirements in
Ah, then adding in factors for efciency and battery life expectancy. Finally, use
battery specication sheets to select your battery. The following formulae applies to
calculating your requirements in Ah.
FORMULA 1 DC Power in Watts (W) DC Volts (V) x DC Current (A)
FORMULA 2 AC Power in watts (W) AC Volts (V) x AC current (A) x Power
Factor (0.8 Typical)
FORMULA 3 DC Power drawn from the
Battery by DC load fed directly
from the battery Power of DC load in Watts (W)
FORMULA 4 DC power drawn from the
battery by AC load fed from
DC-AC inverter
1.2 x Power of AC load in Watts (W)
(Assuming average efciency of
inverter = 84%)
FORMULA 5 Energy consumption from the
battery in Watt Hour (Wh) Power in Watts (W) x time in Hours (h)
FORMULA 6 Energy consumption from the
battery in Ampere Hour (Ah)
12v
Battery Energy consumption in
Watt-Hour (Wh) ÷ 12
24v
Battery Energy consumption in
Watt-Hour (Wh) ÷ 24
Table 3.1. Battery Sizing Formulas
Determining Total Battery Energy Consumption – First step is to determine the total
battery energy consumption in Ampere Hours for running the desired AC and DC
loads during the desired span of backup time:
a) Find out the power rating of each AC and DC device in Watts (W). If Watt
rating is not available, calculate the Watt rating using Formulae 1 or 2.
b) Determine / calculate the power drawn from the battery in Watts (W) by
each of the AC and DC devices. For DC devices, this will be the same as its DC
Power rating (Formula 3). For AC devices powered from DC to AC inverter,
use Formula 4 to calculate the power drawn in Watts (W) from the battery.
c) Calculate the energy consumption in Watt-Hours (Wh) for each load using
Formula 5 based on the number of hours each load is expected to run during the
desired span of backup time. Add all to get the total energy in Watt Hours (Wh).
d) Calculate the total battery energy consumption in Ampere Hours (Ah) for
the combined DC and AC loads using Formula 6.
SECTION 3 | BATTERY THEORY

10 | SAMLEX AMERICA INC.
Determining Actual Ah Capacity of Battery Bank
a) Lead Acid batteries: In applications where your batteries will be discharged
and recharged constantly (cycling), the battery life expectancy will depend
on the depth of discharge on the battery. Deep discharges of the battery will
signicantly reduce the life expectancy. Therefore we recommend no more
than 50% discharge of the battery in cycling applications. To achieve this, the
calculated Ah Capacity should be doubled when selecting a battery.
b) Lithium batteries: Lithium batteries do not receive a signicant impact to their
life when discharged to 80% and have a high cycle count compared to Lead
Acid. Their capacity is also constant across the discharge rate of the battery.
This means you are able to size the battery at only 1.25x the calculated Ah
requirements of your system when selecting your Lithium battery product.
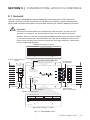
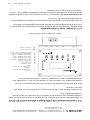
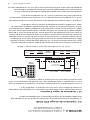
3.2 Series and Parallel Connection of Batteries
3.2.1 Series Connection
Solar Charge Controller
PV +
PV -
BAT +
BAT - 6V Battery 6V Battery
Battery 4 Battery 3
6V Battery
Battery 2
6V Battery
Battery 1
6V Battery
Cable “A”
Cable “B”
Fig. 3.1. Series Connection
When two or more batteries are connected in series, their voltages add up, but their Ah
capacity remains the same. Fig. 3.1 above shows 4 pieces of 6V, 200 Ah batteries connected
in series to form a battery bank of 24V with a capacity of 200 Ah.
3.2.2 Parallel Connection
Solar Charge Controller
PV +
PV -
BAT +
BAT - 12V Battery 12V Battery 12V Battery 12V Battery
Battery 1 Battery 3Battery 2 Battery 4
Cable “A”
Cable “B”
Fig. 3.2. Parallel Connection
When two or more batteries are connected in parallel, their voltage remains the same
but their Ah capacities add up. Fig. 3.2 above shows 4 pieces of 12V, 100 Ah batteries
connected in parallel to form a battery bank of 12V with a capacity of 400 Ah. The
four Positive terminals of Batteries 1 to 4 are paralleled (connected together) and this
SECTION 3 | BATTERY THEORY

10 | SAMLEX AMERICA INC. SAMLEX AMERICA INC. | 11
SECTION 3 | BATTERY THEORY
common Positive connection becomes the Positive terminal of the 12V bank. Similarly,
the four Negative terminals of Batteries 1 to 4 are paralleled (connected together)
and this common Negative connection becomes the Negative terminal of the 12V
battery bank.
3.2.3 Series – Parallel Connection
Solar Charge Controller
PV +
PV -
BAT +
BAT - 6V Battery 6V Battery 6V Battery 6V Battery
String 1 String 2
Battery 1 Battery 3Battery 2 Battery 4
Cable “A”
Cable “B”
Fig. 3.3. Series-Parallel Connection
Figure 3.3 above shows a series – parallel connection consisting of four 6V, 200 Ah
batteries to form a 12V, 400 Ah battery bank. Two 6V, 200 Ah batteries, Batteries 1 and 2
are connected in series to form a 12V, 200 Ah battery (String 1). Similarly, two 6V, 200 Ah
batteries, Batteries 3 and 4 are connected in series to form a 12V, 200 Ah battery (String 2).
These two 12V, 200 Ah Strings 1 and 2 are connected in parallel to form a 12V, 400 Ah bank.
!
CAUTION!
Attention should be paid to the manner in which the charger is connected
to the battery bank. Ensure that if the Positive output cable of the battery
charger (Cable “A”) is connected to the Positive battery post of the rst
battery (Battery 1 in Fig. 3.2) or to the Positive battery post of the rst battery
string (Battery 1 of String 1 in Fig. 3.3), then the Negative output cable of
the battery charger (Cable “B”) should be connected to the Negative battery
post of the last battery (Battery 4 as in Fig. 3.2) or to the Negative Post of the
last battery string (Battery 4 of Battery String 2 as in Fig. 3.3). This connection
ensures the following:
• The resistances of the interconnecting cables will be balanced.
• All the individual batteries / battery strings will see the same series resistance.
• All the individual batteries will charge at the same charging current and
thus, will be charged to the same state at the same time.
• None of the batteries will see an overcharge condition.
If this is not followed, the following may occur in your system:
• All the individual batteries will be charged at different charging current
and thus, will reach fully charged state at different times.

12 | SAMLEX AMERICA INC.
SECTION 3 | BATTERY THEORY
• The battery with lower series resistance will take shorter time to charge
as compared to the battery which sees higher series resistance and
hence, will experience over charging and its life will be reduced.
• Life and capacity of the battery will be reduced.
3.3 Lead Acid Batteries
3.3.1 Battery Types
Sealed Lead Acid (SLA) or Valve regulated Lead Acid (VRLA) Batteries
Sealed Lead Acid (SLA) batteries or Valve Regulated Lead Acid (VRLA) batteries can either
be Gel Cell or AGM (Absorbed Glass Mat). In a Gel Cell battery, the electrolyte is in the
form of a gel. In AGM (Absorbed Glass Mat) battery, the electrolyte is soaked in Glass Mat.
In both these types, the electrolyte is immobile. There are no rell caps and the battery
is totally sealed. Hydrogen and Oxygen released during the charging process are not
allowed to escape and are recombined inside the battery. Hence, there is no water loss
and the batteries are maintenance free. These batteries have safety valves on each cell
to release excessive pressure that may be built up inside the cell. The Gel Cell is the least
affected by temperature extremes, storage at low state of charge and has a low rate of
self discharge. An AGM battery will handle overcharging slightly better than the Gel Cell.
Non Sealed (Vented / Flooded / Wet Cell) Lead Acid Batteries
In a non-sealed / vented / ooded / wet cell battery, each individual cell compartment
has a rell cap that is used to top up the cell with distilled water and to measure
the specic gravity of the electrolyte using a hydrometer. When fully charged, each
individual cell has a voltage of approximately 2.105V and electrolyte specic gravity
of 1.265. As the cell discharges, its voltage and specic gravity drop. Thus, a healthy,
fully charged, 12V nominal battery with each of the 6 cells fully charged to 2.105V
will measure a Standing Voltage of 12.63V at 25ºC / 77ºF. Also, in a healthy battery,
all the individual cells will have the same voltage and same specic gravity. If there is
a substantial difference in the voltages (0.2V or higher) and specic gravities of the
individual cells, the cells will require equalization.
SLI (Starting, Lighting, Ignition) Batteries
SLI batteries that are used for automotive starting, lighting, ignition and powering
vehicular accessories. SLI batteries are designed to produce high power in short bursts for
cranking. SLI batteries use lots of thin plates to maximize the surface area of the battery
for providing very large bursts of current (also specied as Cranking Amps). This allows
very high starting current but causes the plates to warp when the battery is cycled. Vehicle
starting typically discharges 1%-3% of a healthy SLI battery’s capacity. The automotive
SLI battery is not designed for repeated deep discharge where up to 80% of the battery
capacity is discharged and then recharged. If an SLI battery is used for this type of deep
discharge application, its useful service life will be drastically reduced.
This type of battery is not recommended for the storage of energy for DC powered
devices like lighting, radios, inverters, etc. However, they are recommended as
starting battery for the back-up generator.

12 | SAMLEX AMERICA INC. SAMLEX AMERICA INC. | 13
SECTION 3 | BATTERY THEORY
Deep Cycle Lead Acid Batteries
Deep cycle batteries are designed with thick-plate electrodes to serve as primary
power sources, to have a constant discharge rate, to have the capability to be
deeply discharged up to 80% capacity and to repeatedly accept recharging. They are
marketed for use in recreation vehicles (RV), boats and electric golf carts – so they may
be referred to as RV batteries, marine batteries or golf cart batteries.
Lithium Battery (LiFePO4)
Lithium batteries designed for lead acid drop-in replacement are supported by this
charge controller in a 12V nominal or 24V nominal conguration. Ensure that the
manufacturers recommended charge voltages are congured accordingly on the Charge
Controller Dip Switch. Temperature compensation and Equalization should not be used
with Lithium batteries.
Lithium batteries should not be charged below 0C unless specied by the manufacturer.
In some circumstances, the manufacturer will have a BMS and internal heater that
warms the battery to allow charging at temperatures below freezing. Check with the
battery manufacturer if you expect your batteries to drop below freezing temperatures.
3.3.2 Typical Battery Sizes
The Table below shows details of some popular battery sizes:
BCI* GROUP BATTERY VOLTAGE, V TYPICAL CAPACITY, AH
27 / 31 12 105
4 D 12 160
8D 12 225
GC2** 6 220
* Battery Council International ** Golf Cart
Table 3.2. Popular Battery Sizes
3.3.3 Reduced Capacity at Higher Discharge
The rated capacity of the lead acid battery in Ah is normally applicable at a discharge
rate of 20 Hours. This relationship is not linear, as the discharge rate is increased, the
usable capacity reduces, but is more or less according to the Table below:
HOURS OF
DISCHARGE DISCHARGE
RATE DISCHARGE RATE
FOR 100Ah BATTERY USABLE
CAPACITY
20 HRS. C/20 A 5A 100 %
10 HRS. C/10 A 10A 87 %
8 HRS. C/8 A 12.5A 83 %
6 HRS. C/6 A 16.7A 75 %
5 HRS. C/5 A 20A 70 %
3 HRS. C/3 A 33.3A 60 %
2 HRS. C/2 A 50A 50 %
1 HRS. C A 100A 40 %
Table 3.3. Battery Capacity versus Rate of Discharge

14 | SAMLEX AMERICA INC.
100 Ah capacity battery will deliver 100% (i.e. full 100 Ah) capacity if it is slowly discharged
over 20 hours at the rate of C/20 A or 5A. However, if it is discharged at a rate of 2 Hrs.
(C/2A or 50A) then the Table above shows that for 2 Hours discharge rate (C/2A or 50A), the
capacity is reduced to 50% (i.e. 50 Ah). Therefore, at 50 Ampere discharge rate the battery
will actually last for 50 Ah ÷ 50A = 1 Hour.
3.3.4 Battery Efciency
A lead-acid battery has an efciency of only 75% - 85%. The energy lost appears as
heat and warms the battery. This means that the Ampere Hour (Ah) energy required
to charge a battery to its full rated capacity will be approximately 120% to 130%
higher than the Ah capacity rating of the battery.
3.3.5 Impact of Depth of Discharge on Battery Life
The deeper a battery is discharged on each cycle, the shorter the battery life. Using
more batteries than the minimum required will result in longer life for the battery
bank. A typical life cycle chart is given in the Table 3.4 below:
DEPTH OF DISCHARGE
% OF Ah CAPACITY
CYCLE LIFE OF
GROUP 27 / 31
CYCLE LIFE OF
GROUP 8D
CYCLE LIFE OF
GROUP GC2 LiFePO4 (100AH)
10 1000 1500 3800 9000
50 320 480 1100 6000
80 200 300 675 4000
100 150 225 550 2000
Table 3.4. Typical Cycle Life Chart
3.3.6 Effect of Temperature on Lead Acid Batteries
The charging characteristics of the battery will vary with temperature. This is nearly
linear and the Voltage Coefcient of Temperature Change is normally taken as
-3 mV to -5 mV / ºC / Cell. As the temperature rises, the charging voltage is reduced
and as the temperature is decreased, the charging voltage is increased.
All charging voltage set points are normally specied at 25ºC / 77ºF. In solar systems,
battery temperatures often vary up to 15ºC from the 25ºC reference. The Absorption,
Float and Equalization Voltages must then be adjusted or a controller with Temperature
Sensor should be used. Table below shows example of adjustments for Absorption
Voltage of say 14.4V for 12V battery, (based on Voltage Coefcient of Temperature
Change as -5 mV / ºC / Cell or -30mV (.03V) for a 6 cell, 12V battery).
BATTERY TEMPERATURE ABSORPTION VOLTAGE (12V BATTERY)
40ºC 13.95V
25ºC (Reference) 14.4V (Reference)
10ºC 14.85V
Table 3.5. Absorption Voltage vs Temperature (example)
SECTION 3 | BATTERY THEORY

14 | SAMLEX AMERICA INC. SAMLEX AMERICA INC. | 15
SECTION 3 | BATTERY THEORY
In case temperature compensation is not provided, the warmer battery at 40ºC will
begin to heat and outgas at 13.95V and will continue to overcharge until the non-
compensated Absorption Voltage set point is reached (14.4V). In cooler temperatures,
the 10ºC battery will experience severe undercharging, resulting in sulfation.
It is recommended that a battery charger / charge controller with a provision for
temperature sensing and compensation should be used if the battery electrolyte
temperature varies more than 5ºC to 10ºC (9ºF to 18ºF).
Loss of Battery Capacity at Low Temperatures
Batteries lose capacity in low temperatures. At 32ºF (0ºC), a battery will deliver about 70 to
80% of its rated capacity at 80ºF (26.7ºC). If the electrolyte temperature of the battery bank
is lower than 80ºF (26.7ºC), additional batteries will be needed to provide the same usable
capacity. For very cold climates, an insulated / heated battery compartment is recommended.
Freezing of Electrolyte
For applications with low ambient temperature, the lead-acid battery must also be protected
against freezing of the electrolyte. The risk of freezing depends on the state of charge. The
chart given below illustrates the freezing limit as a function of the state of charge.
-80°
-60°
-40°
-20°
0°
020 40 60 80 100
State of charge [%]
Temperature [°C]
slushy until hard
-80°
-60°
-40°
-20°
0°
020 40 60 80 100
State of charge [%]
Temperature [°C]
slushy until hard
STATE OF CHARGE (%)
TEMPERATURE (ºC)
Fig 3.4. Temperature vs State of Charge
3.4 Lithium Batteries
Lead Acid Drop In replacements:
There are a number of different chemistries for Lithium Batteries. The most commonly
used as a Lead Acid battery Drop In Replacement is the LiFePO4 battery chemistry.
These batteries must come with a built in Battery Management System (BMS). This
will employ safe guards on the battery for safety and operation.
Other Lithium Chemistries:
As Lithium evolves into a battery source, there may be other chemistries that come to
market. Review the battery manual and charging specications. Then compare with
the operation of the charge controller. It may be possible for the charger to be setup
for the battery of your selection. The battery must still include a BMS that protects the
battery and for safety as the charge controller will only supply power.

16 | SAMLEX AMERICA INC.
3.4.1 Effects of Temperature on Lithium Batteries
Lithium batteries are not affected by temperature the same way lead acid batteries
are, but the temperature does need to be considered if it drops below freezing.
Lithium batteries should not be charged when the battery temperature drops below
freezing. Most batteries will either cut off or employ an internal heating device to
protect the battery. These are safety devices as charging lithium batteries when the
cells are below freezing may result in re and catastrophic failure of the battery.
Check with your battery manufacturer to see what protections are on your battery for
these conditions.
In general, keep your lithium batteries in a location that keeps them above 0C or in
accordance with the manufacturers specications.
Temperature Compensation: Do not enable temperature compensation on Lithium
Batteries. It may damage the battery and has a potential for being hazardous.
3.4.2 Lithium Batteries in Series and Parallel
Be sure to check with the manufacturer on whether the battery can be placed in series
or parallel. Some lithium battery products do not support series congurations.
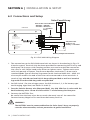
The EVO-30AB is a PWM (Pulse Width Modulation) Solar Charge Controller. It can be
used for 12V or 24V battery systems.
SECTION 4 | FEATURES & OPERATION
4.1 Features
• Functionality expands when connected with an EVOTM Remote Display or
EVOTM Inverter/Charger
• Dual Voltage capability – can be used with 12V or 24V Systems
• 30A charging capacity
• Pulse Width Modulation charging is provided at a PWM frequency of 300 Hz
for low loss, higher efciency charging.
• 4 Stages of charging for 100% return of capacity and long battery life – Bulk,
Absorption, Float and Equalization Stages
• Choice of 8 sets of Absorption / Float / Equalization Voltage settings to enable
complete charging of a wide range of Lead Acid and Lithium Batteries
• Remote Battery Temperature Sensor (BTS) Model 30AB-TS (optional) for
temperature compensation ensures proper charging of batteries that are
exposed to wide temperature variations during the year.
SECTION 3 | BATTERY THEORY

16 | SAMLEX AMERICA INC. SAMLEX AMERICA INC. | 17
4.1.1 Standalone Charge Controller
The EVO-30AB can be installed as a standalone charge controller or it can be added
to other EVOTM products and connected using the communications cable to allow your
EVOTM products to communicate and be monitored from the same remote.
4.1.2 Expanded Use with Other EVOTM Products
The EVO-30AB‘s communications port expands it’s abilities when connected with other
EVOTM products. This allows a few different ways for implementation. There are three
ways the product can be used:
• With EVO-RC-PLUS Remote Display
• With an EVOTM Inverter/Charger and a Remote Display
• With an EVOTM Inverter/Charger and no Remote Display
• Remote Display – EVO-RC-PLUS
The EVO-RC-PLUS is a remote display used to monitor the operation of EVOTM
products. The EVO-30AB is part of this family and can be monitored by the
remote display. Having the remote as a separate unit allows the EVO-30AB charge
controller to be placed in close proximity to the batteries and have the EVO-RC-
PLUS Remote Display placed in a separate location convenient for monitoring.
• EVO-30AB with EVOTM Inverter/Charger and EVO-RC-PLUS
Installing the EVO-30AB Charge Controller, an EVO-RC-PLUS, and an EVOTM Inverter/
Charger makes your complete power system manageable from one monitoring
device. The EVO-RC-PLUS will display alarms and status for both the EVO-30AB
and the EVOTM Inverter/Charger.
When connected together, the EVO-30AB will follow the programmed settings in the
EVOTM Inverter/Charger unit. This will synchronize both units to operate at the same
bulk, absorption, oat, and equalize settings as well as change modes at the same time.
• EVO-30AB with EVOTM Inverter/Charger (no EVO-RC-PLUS)
When the EVO-30AB is installed with an EVOTM Inverter/Charger without the EVO-
RC-PLUS, the EVO-30AB will operate based on the DIP switch settings only. The
inverter/charger will manage its charge current based on the output current of the
EVO-30AB, as described in the EVOTM manual (Section 5.4).
WARNING!
DIP Switch Settings when Communications are disconnected
In all congurations, if the communications cable is disconnected during
operation, the EVO-30AB will act as a standalone charger, using the EVOTM
Inverter/Charger settings until the EVO-30AB is power cycled. After which,
it will use the DIP Switch settings.
SECTION 4 | FEATURES & OPERATION

18 | SAMLEX AMERICA INC.
4.2 EVO-30AB Charging Operation
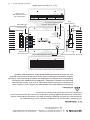
4.2.1 Pulse Width Modulation
In order to understand the working of the controller, it is important to understand the
concept of PWM and Duty Cycle, which are explained with the help of Fig. 4.1.
If you consider that the output of the solar panel is connected to the battery in series
with a switch. Controlled ON / OFF operation of the Switch is used to control the cur-
rent and the voltage to charge the battery.
Fig. 4.1. Series Type PWM Control - PWM Frequency = 300 Hz
2.7A
A
0PULSE PERIOD = 3.33 ms
OFF = 2.5 msON = 0.83 ms
AVERAGE = 0.675A
Pulse Width = ON Time
FREQUENCY = % DUTY CYCLE =
1
PULSE
PERIOD
1
3.33 ms = 300 Hz PULSE WIDTH
PULSE PERIOD
0.83 ms
3.33 ms = 25%=
=
SOLAR
PANEL
BATTERY
SERIES
MOSFET
SWITCH
A solar panel is a current source that outputs almost constant current equal to its
Short Circuit Current (ISC) over a wide voltage range. Through PWM control, the Switch
converts constant Short Circuit Current (ISC) at its input to controlled average current at
its output by varying the Duty Cycle. The average value of output current of the Switch
is equal to the constant input value of Short Circuit Current (ISC) multiplied by the Duty
Cycle. The Duty Cycle is the % of time the switch is ON compared to the switch being
ON 100% of the time. A Duty Cycle of 25%, would mean that out of every second, the
switch will be on 0.25 seconds allowing the current to ow for just that portion of time.
This changes the average amount of current getting to the battery.
Fig 4.1 shows an example where 2.7A constant input Short Circuit Current (ISC) is
reduced to average of 25% or to 0.675A by switching the 2.7A constant Short Circuit
Current (ISC) ON and OFF at 25% Duty Cycle.
PWM consists of repetitive cycles of controlled duration of ON and OFF states of the
Switch. The Pulse Period of one cycle of 300 Hz PWM is the total combined duration
of ON and OFF states of the Switch which is 3.33 ms. Number of cycles of switching per
second is called the PWM Frequency. Mathematically, Frequency = (1 ÷ Pulse Period
“T”) and is 300 Hz in this case (1÷ 33.3 ms = 300 Hz). The duration of ON state is also
called the “Pulse Width”. In PWM control, the duration of the Pulse Width is varied
SECTION 4 | FEATURES & OPERATION

18 | SAMLEX AMERICA INC. SAMLEX AMERICA INC. | 19
(modulated) and is dened by “Duty Cycle” which is the ratio of the “ON Time” to the
“Pulse Period ”. Duty Cycle is normally specied in %. Thus, 0% Duty Cycle will mean
that the switch is constantly OFF (will output 0A) and 100% Duty Cycle will mean that
the switch is constantly ON (will output the full Short Circuit Current (ISC).
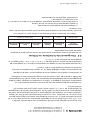
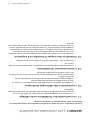
4.2.2 Standard Charging Cycle
Notes:
1. For proper understanding of the charging algorithm, please read Section 3 –
General Information: Batteries.
2. For purposes of explanation given in Fig. 4.2A / 4.2B, it is assumed that there is no
load on the battery during the day when charging is taking place. There is small
lighting load at night, which is switched OFF during the day.
A
NIGHT
STAGE 1
BULK
STAGE 2
ABSORPTION
(1 HOUR)
STAGE 3
FLOAT
DAY
NIGHT
Va Vf
TIME
B
C D
EF
Fig. 4.1A - Normal Charging Algorithm Fig. 4.1B - Equalization Algorithm
BATTERY VOLTAGE
BATTERY VOLTAGE
NIGHT NIGHT
EQUALIZATION
(1/2/3 HOURS)
100% DUTY
CYCLE FLOAT
A1 B1
C1 D1
E1
F1
Ve
Vf
DAY
TIME
Fig. 4.1C LiFePO4 Charging Algorithm
NIGHT NIGHT
EQUALIZATION
(1/2/3 HOURS)
100% DUTY
CYCLE FLOAT
A1 B1
C1 D1
E1 F1
Ve
Vf
DAY
TIME
Fig. 4.2A. Normal Charging Algorithm Fig 4.2B. Equalization Algorithm
Following three types charging algorithms are used to return 100% capacity and
prevent excessive gassing:
• Lead Acid - Normal Charging (Fig 4.2A): This algorithm is used for normal day-to-
day charging. Charging is sequential: Stage 1: Bulk Stage (100% Duty Cycle which
is equivalent to Constant Current) Stage 2: Absorption Stage - constant voltage
charging for 1 hour Stage 3: Float Stage (Very low Duty Cycle of 0% to < 10%
which is equivalent to Constant Voltage).
• Lead Acid - Equalization Charging (Fig 4.2B): This is carried out automatically
after every 28 days or manually. Stage 1: Bulk Stage (100% Duty Cycle which is
equivalent to Constant Current) Stage 2: Equalization Stage - constant voltage
charging at the equalization voltage Stage 3: Float Stage (Very low Duty Cycle
of 0% to < 10% which is equivalent to Constant Voltage).
• Lithium Battery Charging (Fig 4.2A): This algorithm follows the same stages as
lead acid and used for normal day-to-day charging of Lithium LiFePO4 batteries
designed for lead acid drop in replacements. Charging is sequential: Stage 1: Bulk
Stage - Constant Current output until voltage reaches Absorption voltage set
point. Stage 2: Absorption Stage - Constant voltage charging for 30 minutes. Stage
3: Float Stage - Constant voltage charging.
SECTION 4 | FEATURES & OPERATION

20 | SAMLEX AMERICA INC.
SECTION 4 | FEATURES & OPERATION
Transition from one stage to the other will be controlled by the selected Voltage
Regulation Set Points programmed on the EVO-30AB via the DIP switches or from an
EVOTM Inverter/Charger as follows:
• Absorption Voltage Regulation Set Point “Va”
• Equalization Voltage Regulation Set Point “Ve”
• Float Regulation Voltage Set Point “Vf”
4.2.3 Lead Acid Charging
Stage - 1: Bulk Stage. Refer to Fig 4.2A. During night, the battery voltage will drop below
the Float Transition Voltage Set Point “Vf” (Curve portion A to B), as there is no sun and
discharging due to equipment (loads) that are powered during the night.
When the sun is available in the morning, charging commences in Bulk Stage.
During this stage (Curve portion B to C), the Switch is kept at 100% Duty Cycle (ON
continuously) and hence, maximum current equal to the available Short Circuit
Current “Isc” of the panel is fed to the battery and the battery voltage starts rising.
This is equivalent to Constant Current Charging.
When the voltage reaches the Absorption Regulation Voltage Set Point “Va” (Point “C”)
and is sustained for a minimum period of around 50 to 55 sec, the controller transitions
to Absorption Stage. At the end of the Bulk Stage, the battery is charged to around
80% capacity. The balance of 20% capacity is restored in the next Absorption Stage.
Stage - 2: Absorption Stage. Refer to Fig 4.2A. The controller enters this stage at Point “C”
from the previous Bulk Stage when the battery voltage reaches the Absorption Voltage
Regulation Set Point “Va” and is sustained for a minimum period of around 50 to 55 sec.
This stage is timed for 1 Hr - either continuous or cumulative (Curve Portion C to D).
In this stage, the Switch operates under PWM control by feeding pulsing Short Circuit
Current “ISC” with constantly reducing Duty Cycle (< 100% and > 0%) / average current
to keep the battery voltage constant at the Absorption Voltage Regulation Set Point
“Va” (Curve portion C to D). This is equivalent to Constant Voltage Charging. This is an
intentional, controlled over voltage condition for the battery for 1 Hr. This is necessary
to return the balance 20% of the capacity. At this voltage, the battery starts gassing
(evolution of Hydrogen and Oxygen due to electrolysis of water in the electrolyte) and
hence, it is necessary to exit this stage as soon as 100% capacity is restored. If this over
voltage condition is allowed to continues after 100% recharging, the battery will be
damaged due to effects of overcharging like overheating, loss of water, corrosion of the
Positive plates and excessive build up of pressure resulting in acid spillage due to opening
of pressure activated relief valves (sealed batteries). The balance of 20% of the battery
capacity is restored in this stage. As the battery capacity rises from 80% to 100%, the PWM
control tapers the current by continuously reducing the Duty Cycle from < 100% to > 0%.
NOTE: Change over to the next Float Voltage Regulation Set Point “Vf” is possible
only after the battery voltage is held at the selected Absorption Voltage
Regulation Set Point “Va” for continuous or cumulative period of 1 Hour. If
“Va” cannot be maintained continuously / cumulatively for 1 Hr, transition to
La page est en cours de chargement...
La page est en cours de chargement...
La page est en cours de chargement...
La page est en cours de chargement...
La page est en cours de chargement...
La page est en cours de chargement...
La page est en cours de chargement...
La page est en cours de chargement...
La page est en cours de chargement...
La page est en cours de chargement...
La page est en cours de chargement...
La page est en cours de chargement...
La page est en cours de chargement...
La page est en cours de chargement...
La page est en cours de chargement...
La page est en cours de chargement...
La page est en cours de chargement...
La page est en cours de chargement...
La page est en cours de chargement...
La page est en cours de chargement...
La page est en cours de chargement...
La page est en cours de chargement...
La page est en cours de chargement...
La page est en cours de chargement...
La page est en cours de chargement...
La page est en cours de chargement...
La page est en cours de chargement...
La page est en cours de chargement...
La page est en cours de chargement...
La page est en cours de chargement...
La page est en cours de chargement...
La page est en cours de chargement...
La page est en cours de chargement...
La page est en cours de chargement...
La page est en cours de chargement...
La page est en cours de chargement...
La page est en cours de chargement...
La page est en cours de chargement...
La page est en cours de chargement...
La page est en cours de chargement...
La page est en cours de chargement...
La page est en cours de chargement...
La page est en cours de chargement...
La page est en cours de chargement...
La page est en cours de chargement...
La page est en cours de chargement...
La page est en cours de chargement...
La page est en cours de chargement...
La page est en cours de chargement...
La page est en cours de chargement...
La page est en cours de chargement...
La page est en cours de chargement...
La page est en cours de chargement...
La page est en cours de chargement...
La page est en cours de chargement...
La page est en cours de chargement...
La page est en cours de chargement...
La page est en cours de chargement...
La page est en cours de chargement...
La page est en cours de chargement...
La page est en cours de chargement...
La page est en cours de chargement...
La page est en cours de chargement...
La page est en cours de chargement...
La page est en cours de chargement...
La page est en cours de chargement...
La page est en cours de chargement...
La page est en cours de chargement...
La page est en cours de chargement...
La page est en cours de chargement...
La page est en cours de chargement...
La page est en cours de chargement...
La page est en cours de chargement...
La page est en cours de chargement...
La page est en cours de chargement...
La page est en cours de chargement...
-
 1
1
-
 2
2
-
 3
3
-
 4
4
-
 5
5
-
 6
6
-
 7
7
-
 8
8
-
 9
9
-
 10
10
-
 11
11
-
 12
12
-
 13
13
-
 14
14
-
 15
15
-
 16
16
-
 17
17
-
 18
18
-
 19
19
-
 20
20
-
 21
21
-
 22
22
-
 23
23
-
 24
24
-
 25
25
-
 26
26
-
 27
27
-
 28
28
-
 29
29
-
 30
30
-
 31
31
-
 32
32
-
 33
33
-
 34
34
-
 35
35
-
 36
36
-
 37
37
-
 38
38
-
 39
39
-
 40
40
-
 41
41
-
 42
42
-
 43
43
-
 44
44
-
 45
45
-
 46
46
-
 47
47
-
 48
48
-
 49
49
-
 50
50
-
 51
51
-
 52
52
-
 53
53
-
 54
54
-
 55
55
-
 56
56
-
 57
57
-
 58
58
-
 59
59
-
 60
60
-
 61
61
-
 62
62
-
 63
63
-
 64
64
-
 65
65
-
 66
66
-
 67
67
-
 68
68
-
 69
69
-
 70
70
-
 71
71
-
 72
72
-
 73
73
-
 74
74
-
 75
75
-
 76
76
-
 77
77
-
 78
78
-
 79
79
-
 80
80
-
 81
81
-
 82
82
-
 83
83
-
 84
84
-
 85
85
-
 86
86
-
 87
87
-
 88
88
-
 89
89
-
 90
90
-
 91
91
-
 92
92
-
 93
93
-
 94
94
-
 95
95
-
 96
96


Samlex America EVO-30AB Manuel utilisateur
- Taper
- Manuel utilisateur
dans d''autres langues
- English: Samlex America EVO-30AB User manual
Documents connexes
Autres documents
-
Samlexpower SCC-30AB Le manuel du propriétaire
-
-
-
-
-
-
-
-
Dometic Büttner MT ICC 1600 SI-N, MT ICC 3000 SI-N Mode d'emploi
-
Goalzero GZ96110 Mode d'emploi